U.S. tariffs and the potential impact on agriculture
Background
A tariff, or tax levied on imported goods, implemented by the U.S. can negatively impact other countries due to the dollar’s importance in international trade and its population’s propensity to consume. Foreign producers can sell products into the U.S. and then use dollars to purchase goods from other countries. Understanding this dynamic, the Trump Administration is using tariffs to:
- Enhance the competitiveness of domestic industries.
- Penalize countries for policies/actions perceived as damaging to U.S. interests.
- Limit China’s geopolitical influence.
Beyond internal culture/politics, whether and how countries respond with retaliatory tariffs and/or non-tariff trade barriers will vary based on how dependent their economies are on the U.S. and which objective President Trump is looking to accomplish in targeting them.
U.S. trade relations with key agricultural export markets
The greatest share of U.S. agriculture exports goes to Mexico, Canada, China, Asia (other than China) and the European Union. Trade relations with these regions/countries will likely evolve in complex and divergent ways based on unique factors. For instance, the Trump Administration will look to Mexico to limit illegal immigration, and Asia to gain geopolitical influence. Some analysts believe the U.S. is in a process of decoupling its economy from China, suggesting little room for improvement between the two countries.
Impacts will vary by agricultural industry
Tariffs and the subsequent retaliatory actions taken by other countries can be impactful to U.S. agriculture. Industries with a greater share of production going into export markets are more exposed to escalating trade tensions (see chart below). For instance, tariffs applied on almonds, pistachios, wine and wheat products would likely have a greater impact on profitability than if applied to cattle, lemons or softwood logs/lumber. Impacts may include lower demand, loss of market share, excess supply and lower prices. Some industries may be able to offset these effects by displacing imported goods; however, products are often differentiated based on consumer preferences and in-country relationships and are not easily transferable among markets. Exporters may also find it difficult to procure space on shipping vessels if import levels to the U.S. fall. In some cases, industries with minimal exports may benefit from tariffs as they could increase domestic prices without significant loss in total demand.
Production, imports and exports for key agriculture industries in the West 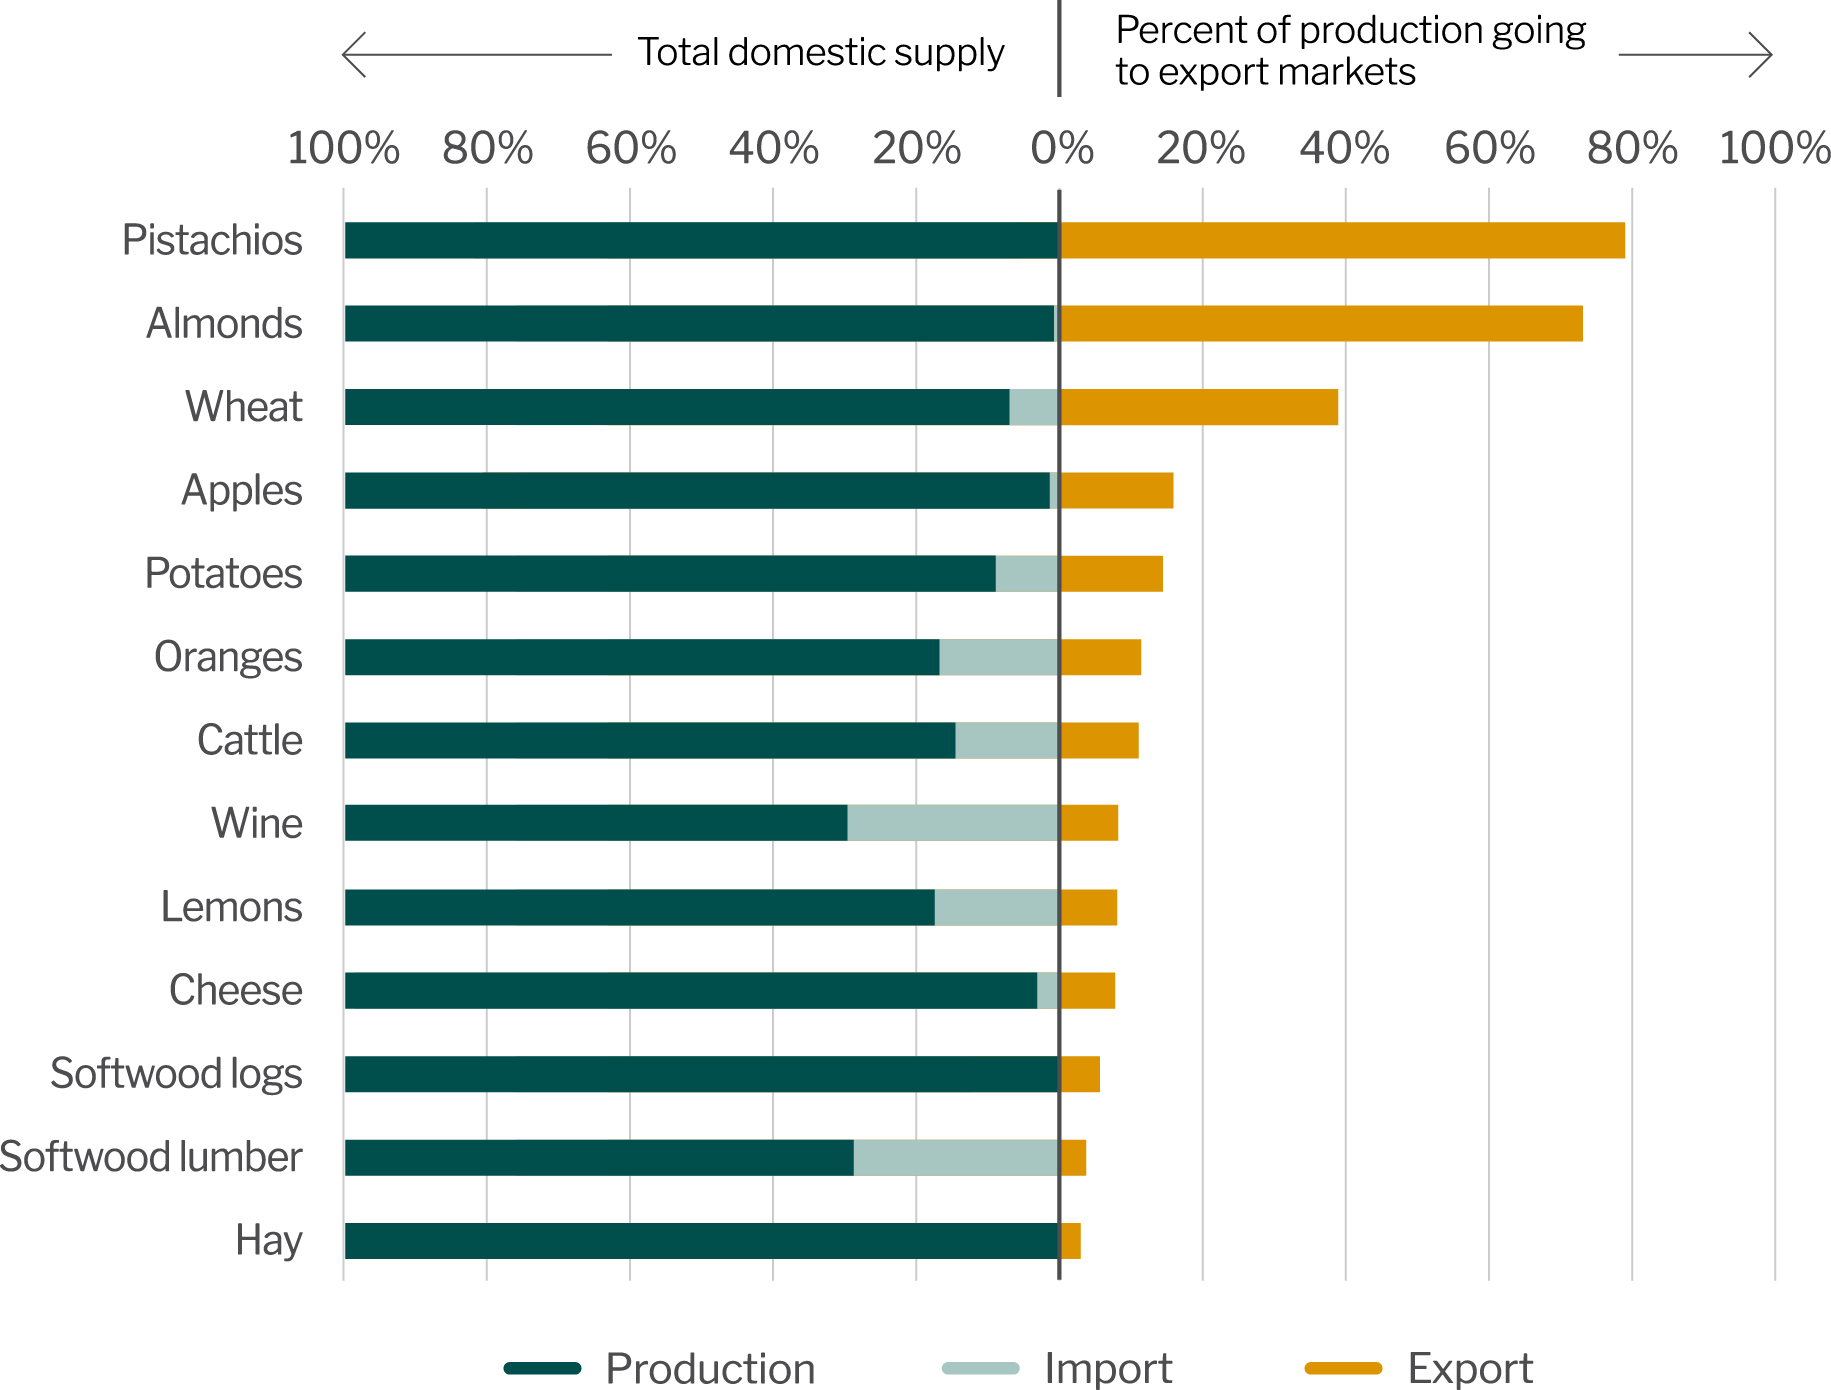
Update: Wine export values in the chart were updated in June 2025.
Sources and assumptions: See notes below.
The current market environment is complex and rapidly evolving, and will likely result in producers facing a high degree of uncertainty for the foreseeable future. It may become increasingly important for producers to understand their industry’s dependence on exports as well as track trade-related policy developments, particularly as they relate to their key export markets.
Notes on chart
Sources: Almond Board July 2025 Position Report, Administrative Committee for Pistachio August 2025 Shipment Report, Census Bureau's USA Trade Online, Forisk Quarterly Reports, Winebusinessanalytics, USApple, USDA Citrus Fruit Summary, USDA ERS, USDA GATS, USDA Quick Stats.
Observations: Assumptions: Import/export percentages represent estimates and may vary based on source/conversion methodology. Trade data pulled from the Census Bureau is aligned with crop years (i.e. Aug-July for almonds, rather than Jan-Feb). Softwood log production is estimated based on softwood lumber production, and recovery factors/conversions differ based on region, including the South (1 thousand board foot (mbf) of lumber requires 4.3 tons of logs, and 1 ton of logs equals .133 mbf of logs) and West (1 mbf of lumber requires .435 mbf of logs). Oranges include mandarins. Cheese includes all varieties including American, cheddar, Italian, and mozzarella. Cheese does not include cottage cheese. Industries with inventory carry-overs from one crop year to the next, export percentages are based on season-to-date shipments.
Return to Industry Insights home page
IN THIS SECTION
![]()
.jpg?sfvrsn=68087301_1 "My project-1 (26)")
Economic headlines, data and trends
Monthly economic trends, data and major industry headlines.
Learn more