June economic headlines
New chairman was appointed to the Federal Reserve (Fed).
Kevin Warsh was appointed as the new Fed chairman. While one of his stated priorities is to ensure price stability, signs of a weakening economy could complicate his efforts. Investors currently expect the Fed to hold the federal funds rate steady through December, though much will depend on how consumer prices evolve.
Strait of Hormuz closure drives inflation higher.
The Strait of Hormuz remains closed, contributing to elevated energy prices. Oil traded between $87 to $109 / barrel in May, representing immense volatility and notably higher prices than pre-conflict levels (see Crop Inputs and Spotlight sections for more information). Persistently high oil prices will continue to pressure consumer prices, which have risen 1.8% since January.
Rising inflation lowers consumer wealth.
Real disposable income fell 1.1% over the past three months due to rising inflation. While consumption has held steady, credit card and revolving debt increased by 1.2% and the savings rate fell from 4.3% to 2.6% (nearing multi-decade lows). Falling consumer wealth could eventually weaken economic activity.
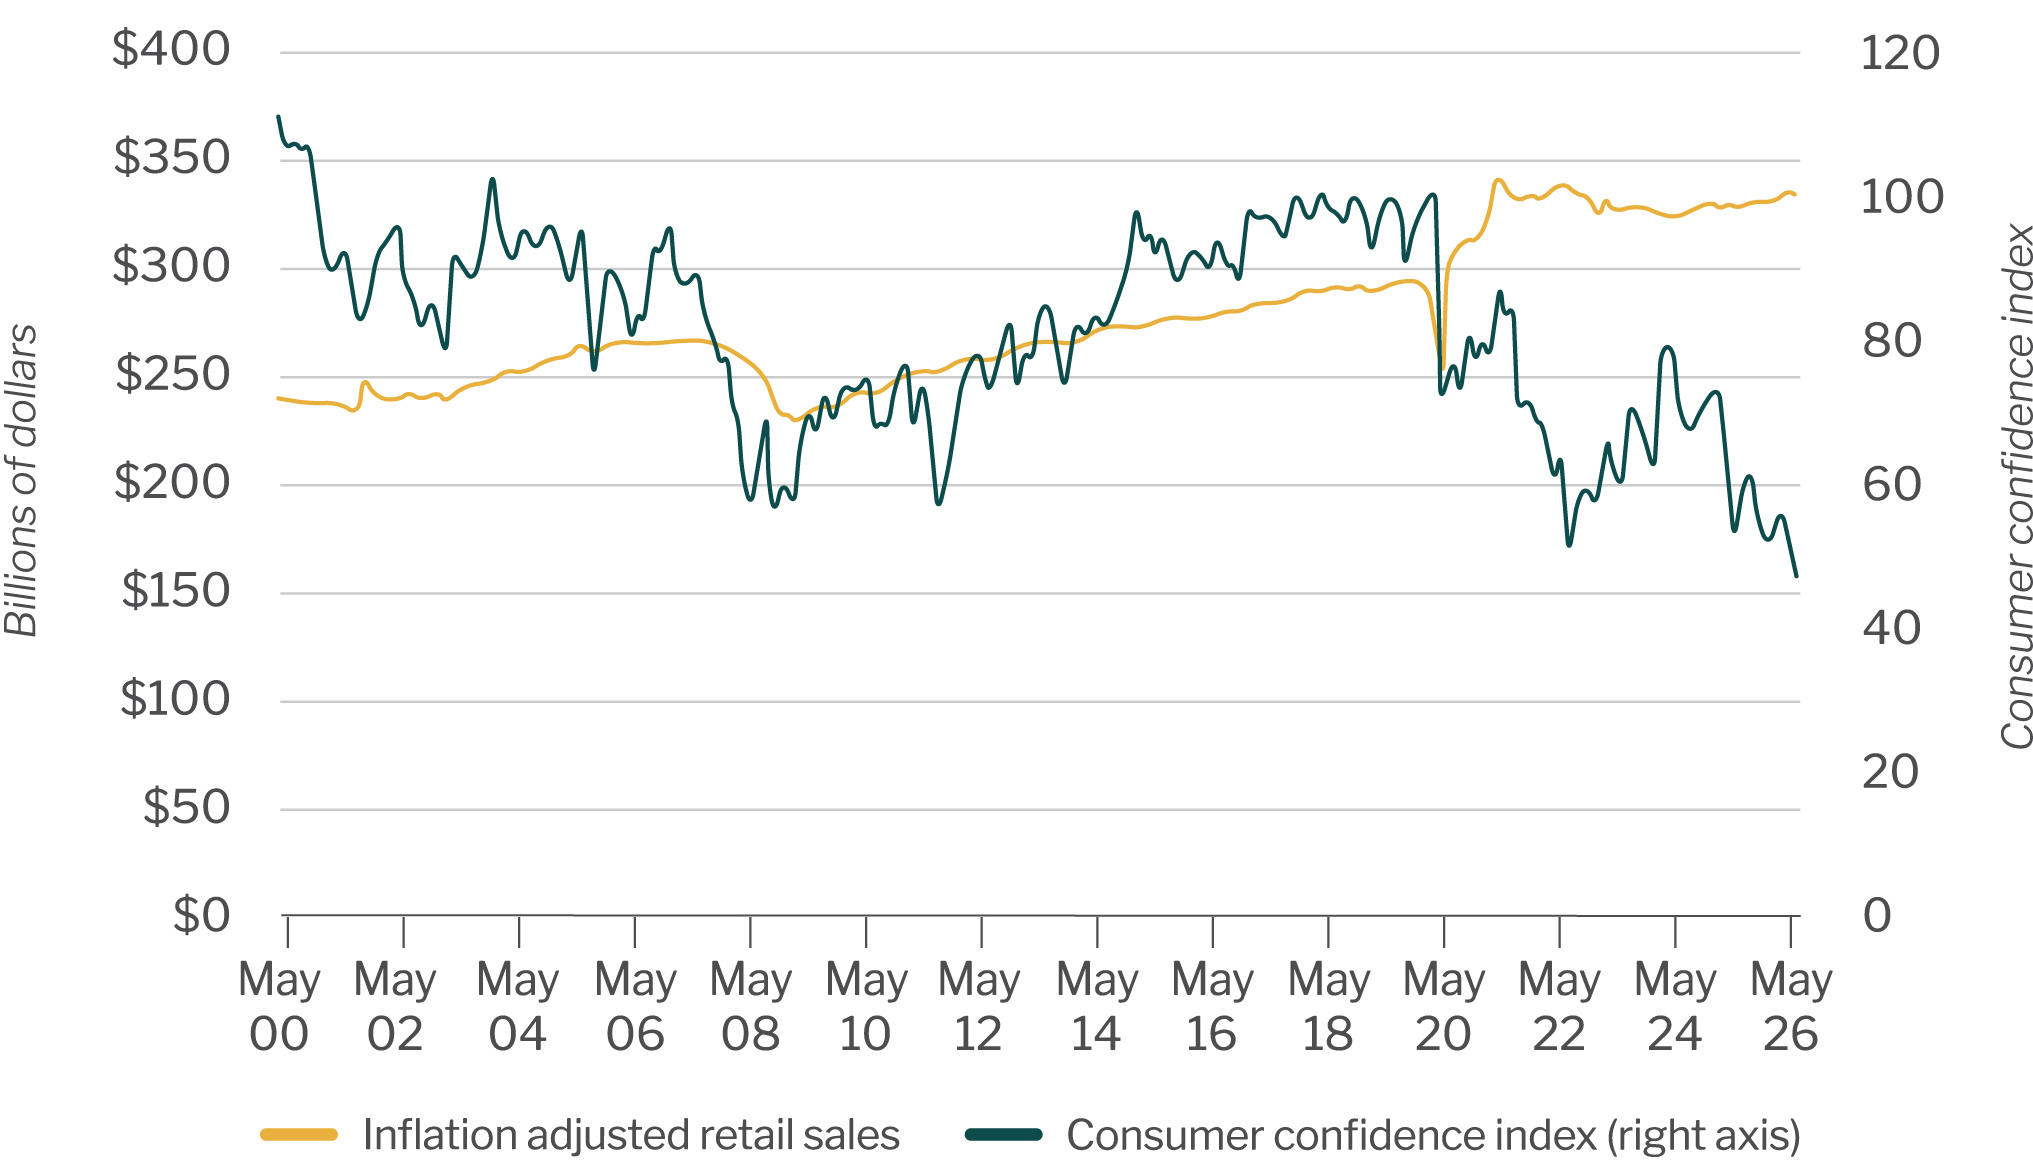
Consumer confidence falls sharply.
University of Michigan’s Consumer Confidence Index reached all-time lows, driven by falling real wages and rising inflation expectations. While some economists expect this to reduce consumption and overall economic activity, historical data suggests little correlation between sentiment and spending (see chart below).
.jpg?sfvrsn=bc72c53a_1 "My project-1 (18)")
Industry Insights
Access monthly updates on top commodities and the economy, plus special reports on profitability, land values and drought.
Learn more
Quarterly Economic Update
The U.S. economy continues to navigate policy changes, trade uncertainty, and evolving monetary policy.
Learn moreGo to Industry Insights homepage