Dairy updates
Dairy margins improve as milk production surges.
National milk production is expanding as improved profitability supports herd growth. In April, the U.S. dairy herd increased to 9.65 million cows, driving a 2.7% year-over-year increase in milk production. Most major dairy states posted higher cow numbers, though Washington was an exception as cows shifted to nearby states. Production gains in the West were led by Oregon, Idaho and California, which increased by 7.0%, 3.0% and 2.3%, respectively, compared to a year ago.
Margins have strengthened meaningfully, with Dairy Margin Coverage (DMC) income over feed costs rising to $10.54 per cwt in April, the highest level in six months and up $2.73 per cwt since the start of the year. This improvement has been driven by higher all-milk prices, supported by a rally in Class IV futures and persistently low feed costs.
Tight nonfat dry milk (NDM) supplies and strong butter demand are sustaining elevated Class IV prices and driving increased depooling activity. As NDM prices rise, the spread between Class III and Class IV milk has widened significantly, with Class IV holding a premium of more than $5 per cwt, the largest on record. This pricing advantage is incentivizing producers to depool to capture higher returns. The impact is especially evident in California, where Class IV utilization in the pool has dropped sharply from 38.1% in April 2025 to just 2.7% in April 2026.
Profitability
June 10, 2026Dairy: Slightly profitable - Neutral 12-month outlook
Improving milk prices and relatively low feed costs, combined with added revenue from elevated beef values, support modest profitability.
The U.S. ranks as the second-largest exporter of dairy products, following the European Union. Over 15% of U.S. dairy production is exported. Mexico and Canada are the top destinations, accounting for more than 40% of total exports. Key U.S. dairy exports include nonfat dried milk, skim milk powder, cheese, whey, lactose, butter and other products. For cheese, major export markets include Mexico, South Korea, Japan and Canada.
The U.S. also imports a significant amount of cheese, primarily from the European Union. Many of these imported cheeses carry geographic indicators, signifying they originate from specific regions and are uniquely tied to those areas. This designation prevents others from replicating such cheeses outside their original region, ensuring their distinctiveness.
Cheese production, exports and imports
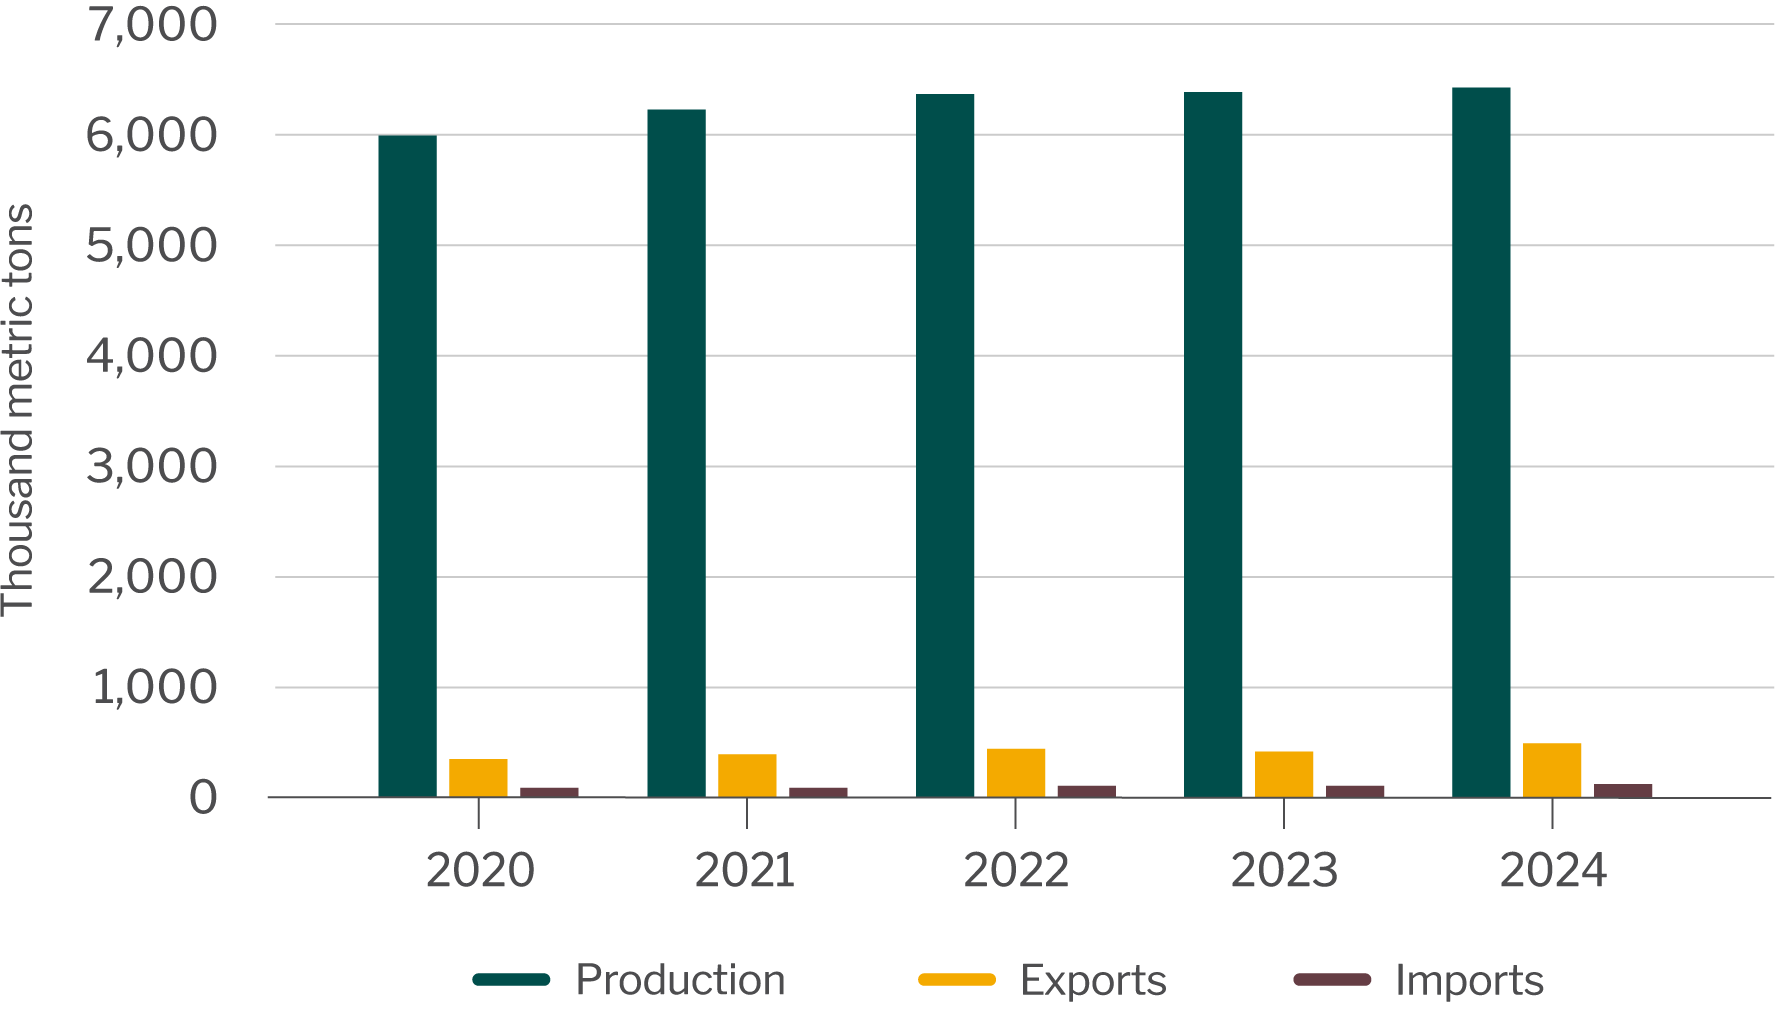
Source: USDA National Agriculture Statistics Service. U.S. Census Bureau.
Tariff tracker - Tariff rates applied to U.S. trade partners are consistenly updated to reflect policy changes. The World Trade Organization (WTO) tracks duties and tariffs on dairy products. For your convenience, the following links will take you to tariff data on cheddar cheese (a leading U.S. export for the dairy industry) for top markets including South Korea and Japan. Dairy products are currently exempt from tariffs for Mexico and Canada under the United States-Mexico-Canada Agreement (USMCA), but please refer to the U.S. Trade Representative website for up-to-date information. WTO also tracks rates for dairy imports to the U.S. Please consult with a trade lawyer or professional for detailed and up-to-date insights on tariff rates and their application to dairy products.
For guidance on interpreting duty and tariff rates, please refer to our Tariff Guide.
Dairy updates
Dairy margins improve as milk production surges.
National milk production is expanding as improved profitability supports herd growth. In April, the U.S. dairy herd increased to 9.65 million cows, driving a 2.7% year-over-year increase in milk production. Most major dairy states posted higher cow numbers, though Washington was an exception as cows shifted to nearby states. Production gains in the West were led by Oregon, Idaho and California, which increased by 7.0%, 3.0% and 2.3%, respectively, compared to a year ago.
Margins have strengthened meaningfully, with Dairy Margin Coverage (DMC) income over feed costs rising to $10.54 per cwt in April, the highest level in six months and up $2.73 per cwt since the start of the year. This improvement has been driven by higher all-milk prices, supported by a rally in Class IV futures and persistently low feed costs.
Tight nonfat dry milk (NDM) supplies and strong butter demand are sustaining elevated Class IV prices and driving increased depooling activity. As NDM prices rise, the spread between Class III and Class IV milk has widened significantly, with Class IV holding a premium of more than $5 per cwt, the largest on record. This pricing advantage is incentivizing producers to depool to capture higher returns. The impact is especially evident in California, where Class IV utilization in the pool has dropped sharply from 38.1% in April 2025 to just 2.7% in April 2026.
Profitability
June 10, 2026Dairy: Slightly profitable - Neutral 12-month outlook
Improving milk prices and relatively low feed costs, combined with added revenue from elevated beef values, support modest profitability.
The U.S. ranks as the second-largest exporter of dairy products, following the European Union. Over 15% of U.S. dairy production is exported. Mexico and Canada are the top destinations, accounting for more than 40% of total exports. Key U.S. dairy exports include nonfat dried milk, skim milk powder, cheese, whey, lactose, butter and other products. For cheese, major export markets include Mexico, South Korea, Japan and Canada.
The U.S. also imports a significant amount of cheese, primarily from the European Union. Many of these imported cheeses carry geographic indicators, signifying they originate from specific regions and are uniquely tied to those areas. This designation prevents others from replicating such cheeses outside their original region, ensuring their distinctiveness.
Cheese production, exports and imports
Source: USDA National Agriculture Statistics Service. U.S. Census Bureau.
Tariff tracker - Tariff rates applied to U.S. trade partners are consistenly updated to reflect policy changes. The World Trade Organization (WTO) tracks duties and tariffs on dairy products. For your convenience, the following links will take you to tariff data on cheddar cheese (a leading U.S. export for the dairy industry) for top markets including South Korea and Japan. Dairy products are currently exempt from tariffs for Mexico and Canada under the United States-Mexico-Canada Agreement (USMCA), but please refer to the U.S. Trade Representative website for up-to-date information. WTO also tracks rates for dairy imports to the U.S. Please consult with a trade lawyer or professional for detailed and up-to-date insights on tariff rates and their application to dairy products.
For guidance on interpreting duty and tariff rates, please refer to our Tariff Guide.
